Technical Analysis and Chart Reading:
First of all, what is technical analysis? It is promoted as a complicated study that requires rigorous preparation and hours of going through charts. People are selling their courses for thousands of rupees. Some claim a 90% success rate in their technical analysis strategies. As always, I ask politely, Sirji, if you are earning money 90% of the time, you are already a millionaire. Why are you selling the courses? Just make them free for everyone.
In this article, I will share a simple positional trading setup I follow. It is not a 90% success strategy. In fact, I do not know the success rate of this. My target is to make 25% returns per year after all expenses. Even if you make 25% per year consistently, you can triple your money every 5 years. Whereas, Nifty’s annual returns are 13.6% in the last 20 years, and it takes 9 years to triple your money at this CAGR.
Chart Analysis:
A chart is a graphical representation of a stock’s price movement over a certain period. If you observe it clearly, you should get an idea of how the stock price has been behaving. For example, if the stock moves in a range between two price levels, say between ₹50 and ₹100, it is range bound. Investors are confused about whether to accumulate for a price more than ₹100 or exit it at a price of around ₹50. On the contrary, if the stock falls to ₹50, fresh buying starts, and the price moves toward ₹100. This price action might continue for a few months to some years. There is always a reason for stock price being stuck in a range. It could be continuous poor results, news emerging on unethical practices by the board members of that company, altercations between the board members and promoters, or other management reasons.
Technical Analysis along with Fundamental Analysis:
To understand this range-bound movement, you should analyze the fundamentals of that stock. Most of the time, the underlying company fails to report good results during that period. As soon as the company starts showing positive results, the stock breaks the upper range and continues to move in an upward direction. But, if the company performs even worse and reports a big loss or if any news of a scam involved in the company comes out, the stock might break the lower limit of ₹50 and move further down.
According to me, technical analysis without fundamental analysis is just like testing the blood sugar levels of a person without knowing about him. For example, he would have had a large piece of cake and a bottle of coke before his blood sample was collected. If the report shows blood sugar levels of 200mg/dl, it does not mean he has diabetes. The reports might have shown normal blood glucose levels if he had eaten a normal meal with a considerably lower sugar intake. The same applies to the stock as well, how could we know whether the price movement in the stock is authentic without knowing anything about the fundamentals of that stock?
My Positional Trading Strategy:
For this positional trading strategy, it is important to select the stock based on fundamentals first, and then we should go for technical analysis or chart analysis. I have already posted two articles and videos on fundamental analysis. You will learn some of the fundamental factors to consider when selecting a stock for this positional trading strategy. I will post the link at the end of this article.
I prefer a weekly chart for positional trading. For me, positional trading means holding the stock for a minimum of 3 months to 2 years. The target range is usually between 35% and 100% depending on the trade or price movement of the stock. I follow a basic trade plan and do not emphasize too much on technical indicators. It is important to use this strategy only on fundamentally good stocks with high liquidity.
A Stop-loss or No Stop-loss!
The definition of positional trading might be different for other traders. Everyone has their strategy when it comes to stock trading or investing. Almost everyone trading in the stock market trades with a stop loss. But I do not place any stop losses for my trades. It is my personal choice. According to me, people lose more money falling trap of stop-loss hunting rather than a trade failure.
As long as you have done a good job on fundamental analysis, then there is no need to panic if the stock falls by 15% – 20% after the entry. But if you want to put a stop loss, it is better to place it under weekly lows of the entry candle or nearest support level.
A Possible Trade in Infosys:
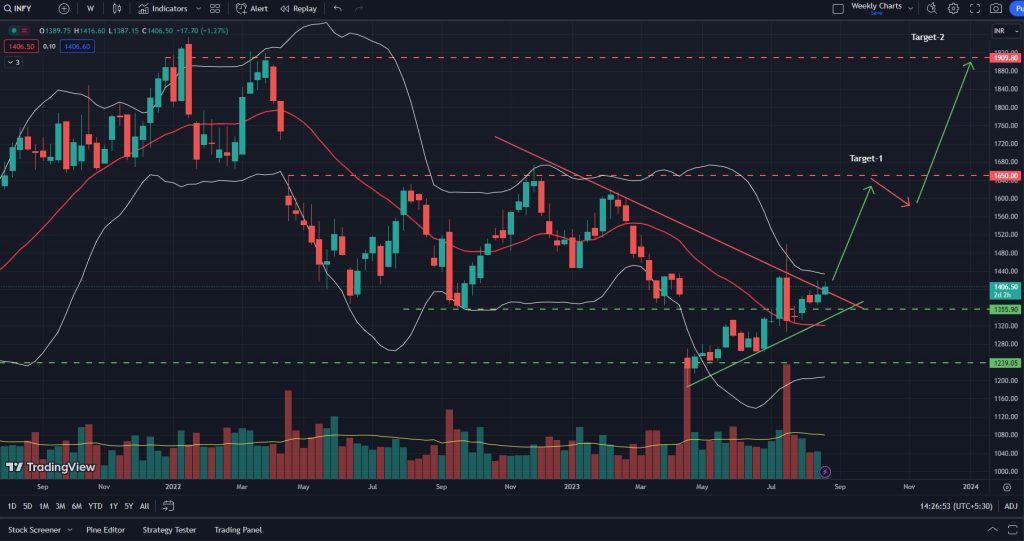
Let us take an example. I will explain this strategy using the weekly chart of Infosys. I have taken it as an example since Infosys traded in a range between ₹1650 and ₹1350 for almost a year and it broke down on a support level of 1350 in April 2023 after posting results that were not received well by the stock market for the last quarter of 2022-23.
Refer to the INFY chart below…
Reversal from All-Time Highs:
Infosys shares have reached all-time highs around ₹1950 in January 2022. Since then, the stock has lost its momentum and reversed its direction. Expectations were higher on IT stocks after stellar results in 2021. But almost all the IT stocks were not able to meet the expectations of investors in stock markets. Even though the results were not that bad, markets rejected the IT stocks. With losing momentum and brokerages reducing their targets, IT stocks only continued to fall since the early months of 2022.
Present Opportunity:
After four months, Infosys has successfully broken above that ₹1350 levels (green dotted line) and is trading above 20 sma on weekly charts. So it seems like a good entry for a positional trade with a target of 35% upside. If the stock closes at ₹1400 this week, it will close above the downward trend line (red color line) after the last 10 months. There is also a short-term upward trend line (green color line) acting as support for the last 4 months. Stop loss could be placed below ₹1350. But I am against putting a stop-loss. Since Infosys is a large-cap stock with great fundamentals, there is no need for a stop-loss. Make sure that you do not invest borrowed money in the trade; if that’s the case, better to put a stop-loss.
The short-term target could be booked at 1650/- at 17.8% profit. The stock has the potential to reach ₹1900 within the next 6 months if the situations get better for IT stocks. Remember, companies have to deliver according to the expectations of markets for the prices to move higher. There is no guarantee of anything happening in stock markets.
The stock referred to in this article is not a recommendation to anyone and is only for educational purposes. Consult SEBI-certified financial advisors for investing advice.
Useful Links: